|
Bio-Techne corporation
recombinant mouse timp-1 protein, cf Recombinant Mouse Timp 1 Protein, Cf, supplied by Bio-Techne corporation, used in various techniques. Bioz Stars score: 93/100, based on 1 PubMed citations. ZERO BIAS - scores, article reviews, protocol conditions and more https://www.bioz.com/product/mouse+recombinant+mr+timp+1/Recombinant+Mouse+TIMP-1+Protein%2C+CF/bio-techne+corporation___980-mt Average 93 stars, based on 1 article reviews
recombinant mouse timp-1 protein, cf - by Bioz Stars,
2026-10
93/100 stars
|
Buy from Supplier |
|
R&D Systems
antibodies against rat timp 1 Antibodies Against Rat Timp 1, supplied by R&D Systems, used in various techniques. Bioz Stars score: 90/100, based on 1 PubMed citations. ZERO BIAS - scores, article reviews, protocol conditions and more https://www.bioz.com/product/mouse+recombinant+mr+timp+1/Mouse+TIMP-1+Antibody/pmc02907429-141-17-27 Average 90 stars, based on 1 article reviews
antibodies against rat timp 1 - by Bioz Stars,
2026-10
90/100 stars
|
Buy from Supplier |
|
R&D Systems
mouse recombinant timp 1 Mouse Recombinant Timp 1, supplied by R&D Systems, used in various techniques. Bioz Stars score: 93/100, based on 1 PubMed citations. ZERO BIAS - scores, article reviews, protocol conditions and more https://www.bioz.com/product/mouse+recombinant+mr+timp+1/Mouse+TIMP-1+Antibody/pmc04116228-41-0-11 Average 93 stars, based on 1 article reviews
mouse recombinant timp 1 - by Bioz Stars,
2026-10
93/100 stars
|
Buy from Supplier |
|
Thermo Fisher
gene exp timp1 mm01341361 m1  Gene Exp Timp1 Mm01341361 M1, supplied by Thermo Fisher, used in various techniques. Bioz Stars score: 98/100, based on 1 PubMed citations. ZERO BIAS - scores, article reviews, protocol conditions and more https://www.bioz.com/product/mouse+recombinant+mr+timp+1/Gene+Exp%2E+Timp1%2C+Mm01341361_m1/pmc06643297-302-44--1 Average 98 stars, based on 1 article reviews
gene exp timp1 mm01341361 m1 - by Bioz Stars,
2026-10
98/100 stars
|
Buy from Supplier |
|
R&D Systems
recombinant mouse timp 1 Recombinant Mouse Timp 1, supplied by R&D Systems, used in various techniques. Bioz Stars score: 93/100, based on 1 PubMed citations. ZERO BIAS - scores, article reviews, protocol conditions and more https://www.bioz.com/product/mouse+recombinant+mr+timp+1/Recombinant+Mouse+TIMP-1+Protein%2C+CF/10__2147_slash_ijn__s54750-79-0-8 Average 93 stars, based on 1 article reviews
recombinant mouse timp 1 - by Bioz Stars,
2026-10
93/100 stars
|
Buy from Supplier |
|
Santa Cruz Biotechnology
timp1  Timp1, supplied by Santa Cruz Biotechnology, used in various techniques. Bioz Stars score: 96/100, based on 1 PubMed citations. ZERO BIAS - scores, article reviews, protocol conditions and more https://www.bioz.com/product/mouse+recombinant+mr+timp+1/TIMP-1+Antibody/10__1158_slash_0008___5472__can___10___2868-50-17-22 Average 96 stars, based on 1 article reviews
timp1 - by Bioz Stars,
2026-10
96/100 stars
|
Buy from Supplier |
|
Sino Biological
human h timp1  Human H Timp1, supplied by Sino Biological, used in various techniques. Bioz Stars score: 91/100, based on 1 PubMed citations. ZERO BIAS - scores, article reviews, protocol conditions and more https://www.bioz.com/product/mouse+recombinant+mr+timp+1/Mouse+TIMP1+%2F+TIMP+%2F+CLGI+Protein/bio_rxiv__2023__08__25__554834-230-9-12 Average 91 stars, based on 1 article reviews
human h timp1 - by Bioz Stars,
2026-10
91/100 stars
|
Buy from Supplier |
|
Thermo Fisher
gene exp 18s hs03003631 g1 Gene Exp 18s Hs03003631 G1, supplied by Thermo Fisher, used in various techniques. Bioz Stars score: 90/100, based on 1 PubMed citations. ZERO BIAS - scores, article reviews, protocol conditions and more https://www.bioz.com/product/mouse+recombinant+mr+timp+1/Gene+Exp%2E+18S%2C+Hs03003631_g1/pm30244972-308-236-238 Average 90 stars, based on 1 article reviews
gene exp 18s hs03003631 g1 - by Bioz Stars,
2026-10
90/100 stars
|
Buy from Supplier |
|
R&D Systems
recombinant timp1  Recombinant Timp1, supplied by R&D Systems, used in various techniques. Bioz Stars score: 94/100, based on 1 PubMed citations. ZERO BIAS - scores, article reviews, protocol conditions and more https://www.bioz.com/product/mouse+recombinant+mr+timp+1/Recombinant+Human+TIMP-1+Protein%2C+CF/pmc04279190-52-6-38 Average 94 stars, based on 1 article reviews
recombinant timp1 - by Bioz Stars,
2026-10
94/100 stars
|
Buy from Supplier |
|
R&D Systems
timp 1 Timp 1, supplied by R&D Systems, used in various techniques. Bioz Stars score: 93/100, based on 1 PubMed citations. ZERO BIAS - scores, article reviews, protocol conditions and more https://www.bioz.com/product/mouse+recombinant+mr+timp+1/Recombinant+Human+TIMP-1+Protein%2C+CF/pm22289852-139-5-17 Average 93 stars, based on 1 article reviews
timp 1 - by Bioz Stars,
2026-10
93/100 stars
|
Buy from Supplier |
|
R&D Systems
anti human timp Anti Human Timp, supplied by R&D Systems, used in various techniques. Bioz Stars score: 93/100, based on 1 PubMed citations. ZERO BIAS - scores, article reviews, protocol conditions and more https://www.bioz.com/product/mouse+recombinant+mr+timp+1/Human+TIMP-1+Antibody/us06986995-529-27-35 Average 93 stars, based on 1 article reviews
anti human timp - by Bioz Stars,
2026-10
93/100 stars
|
Buy from Supplier |
|
Cell Signaling Technology Inc
anti timp1 antibody Anti Timp1 Antibody, supplied by Cell Signaling Technology Inc, used in various techniques. Bioz Stars score: 95/100, based on 1 PubMed citations. ZERO BIAS - scores, article reviews, protocol conditions and more https://www.bioz.com/product/mouse+recombinant+mr+timp+1/TIMP1+Rabbit+mAb/bio_rxiv__2023__08__25__554834-237-10-19 Average 95 stars, based on 1 article reviews
anti timp1 antibody - by Bioz Stars,
2026-10
95/100 stars
|
Buy from Supplier |
Image Search Results
Journal: Cell metabolism
Article Title: Inhibition of acetyl-CoA carboxylase (ACC) by phosphorylation or by the liver-specific inhibitor, ND-654, suppresses lipogenesis and hepatocellular carcinoma
doi: 10.1016/j.cmet.2018.08.020
Figure Lengend Snippet: KEY RESOURCES TABLE
Article Snippet: TaqMan Assay IDs are as follows: for rat studies: 18S : Hs03003631_g1; Cxcl1 : Rn00578225_m1; Il-1b : Rn00580432_m1; Il-6 : Rn01410330_m1; Tnfa : Rn99999017_m1; Cd80 : Rn00709368; and Cd163 : Rn01492519_m1, and for mouse studies: Tbp : Mm01277042_m1; Il-6 Mm00446190_m1; Tnfa Mm00443258_m1; Timpl :
Techniques: Recombinant, Enzyme-linked Immunosorbent Assay, Quantitation Assay, Software
Journal: Cancer Research
Article Title: LOXL2-Mediated Matrix Remodeling in Metastasis and Mammary Gland Involution
doi: 10.1158/0008-5472.can-10-2868
Figure Lengend Snippet: Figure 4. LOXL2 regulates TIMP1. A, Western blot analysis of LOXL2 protein expression and TIMP1 in concentrated CM from 4T1/MDA-MB-231 cells expressing control or LOXL2 shRNA constructs, or transfected with siLOXL2 (compared with mock-transfected control). B, immunofluorescent images of tumor sections from mice bearing 4T1/MDA-MB-231 control or shLOXL2 tumors stained with TIMP1 (green) and 40,6-diamidino-2-phenylindole (DAPI; blue). Scale bar, 100 mm. C, quantification of MDA-MB-231 control or siLOXL2 breast cancer cells þ/ recombinant human TIMP1 invading through matrigel towards a chemoattractant. *P < 0.05. D, invasive branching structures formed by MDA-MB-231control or siLOXL2 cells grown in 3D Matrigel, treated recombinant human TIMP1. Scale bar, top; 500 mm, bottom; 200 mm.
Article Snippet: The gels were transferred to polyvinylidene difluoride membranes (Millipore) and probed with antibodies specific to human LOXL2,
Techniques: Western Blot, Expressing, Control, shRNA, Construct, Transfection, Staining, Recombinant

Journal: Cancer Research
Article Title: LOXL2-Mediated Matrix Remodeling in Metastasis and Mammary Gland Involution
doi: 10.1158/0008-5472.can-10-2868
Figure Lengend Snippet: Figure 5. High LOXL2 expression and activity during mammary gland involution. A, qRT-PCR analysis of LOXL2 mRNA expression levels in FVB mouse mammary gland samples at different stages of development (wV ¼ week virgin, dP ¼ day pregnancy, dL ¼ day lactation, dI ¼ day involution). n ¼ 3 mice per time point. * P < 0.05. B, Western blot analysis of LOXL2 and TIMP1 protein expression in lysates prepared from mice in (A). C, LOXL2 enzymatic activity in blood serum from mice in (A). n ¼ 3 mice per time point.
Article Snippet: The gels were transferred to polyvinylidene difluoride membranes (Millipore) and probed with antibodies specific to human LOXL2,
Techniques: Expressing, Activity Assay, Quantitative RT-PCR, Western Blot
Journal: bioRxiv
Article Title: Network-based prioritisation and validation of novel regulators of vascular smooth muscle cell proliferation in disease
doi: 10.1101/2023.08.25.554834
Figure Lengend Snippet: (A) Predicted inputs to TIMP1 in the PrP GRN, coloured as described in left panel of . (B) Representative immunohistochemistry image for αSMA (blue) and TIMP1 (brown) in non-plaque human aorta (N=7), scale bar=500 µm (overview) and 100 µm (zoomed view). (C) Enrichment plots from gene set enrichment analysis (GSEA) for E2F targets (p adj = 0.005) and G2M checkpoint genes (p adj = 0.04) in bulk RNA-seq data from human VSMCs (hVSMCs) treated with 500 ng/mL recombinant human (rh) TIMP1 for 6 hours versus control cells (N=6 independent hVSMC isolates). (D) Proportion of EdU+ hVSMCs following 16 hours EdU incorporation in cells treated with 500 ng/mL rhTIMP1 or vehicle controls (CTRL), standardised to the average of all samples (N=6 independent hVSMC isolates). (E) Representative images of Myh11-Confetti VSMCs isolated from murine aortas and cultured for 21 days in the presence of vehicle control, 500 ng/mL recombinant murine TIMP1 or 2 ng/mL PDGF-BB. Scale bar=500 µm. (F, G) Quantification of number and size of clonally expanded patches of Confetti+ VSMCs over 21 days of culture. Statistical significance assessed via a generalised linear model, N=4 animals.
Article Snippet: Cells were treated with recombinant (r) murine (m) or
Techniques: Immunohistochemistry, RNA Sequencing Assay, Recombinant, Isolation, Cell Culture
Journal: bioRxiv
Article Title: Network-based prioritisation and validation of novel regulators of vascular smooth muscle cell proliferation in disease
doi: 10.1101/2023.08.25.554834
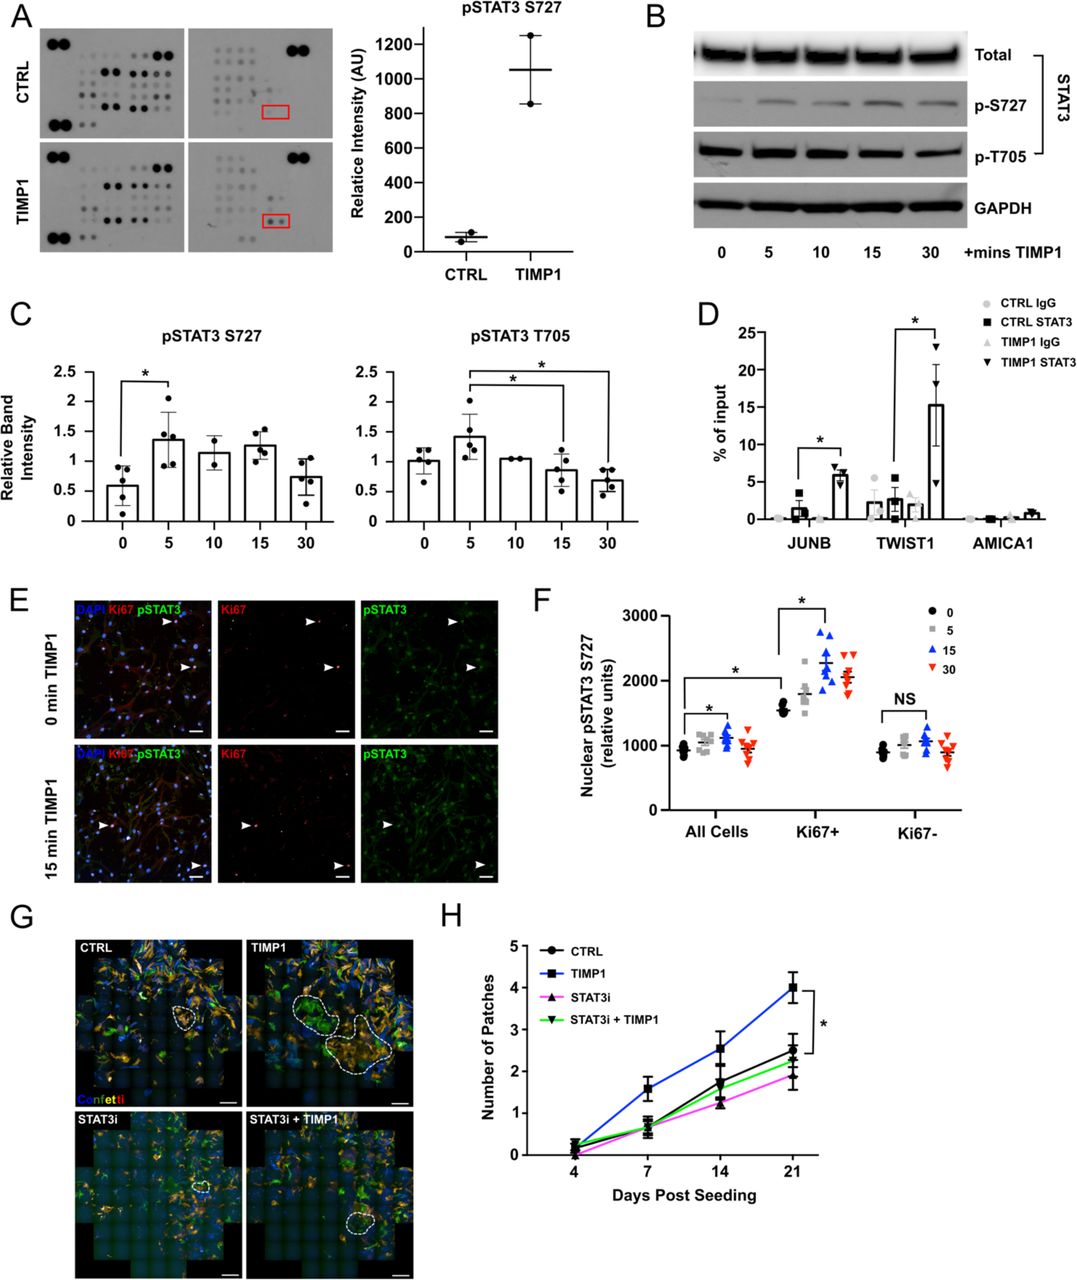
Figure Lengend Snippet: (A) Proteome profiler phosphokinase array of human VSMCs (hVSMCs) following 15 minutes treatment of 500 ng/mL recombinant human (rh) TIMP1 or vehicle control. Quantification of relative spot intensity by densitometry. (B) Western blot of total, pS727 and pT705 STAT3 in serum starved hVSMCs analysed 0, 5 10, 15 or 30 minutes after rhTIMP1 treatment. (N=5 hVSMC isolates). (C) Quantification of relative band intensity, normalised to total STAT3 levels (N=5 hVSMC isolates), statistical significance determined using ANOVA. (D) ChIP qPCR analysis of STAT3 binding at STAT3 targets ( TWIST and JUN ) and a negative control ( AMICA1 ) gene promoters, in serum starved control hVSMCs and 15 minutes following 500 ng/mL rhTIMP1 treatment. Graph shows anti-STAT3 and control IgG precipitated DNA as a percent of input. N=3 hVSMC isolates. (E) Representative images of STAT3 and Ki67 staining in serum starved control hVSMCs and after 15 mins 500 ng/mL rhTIMP1 treatment (N=3 hVSMC isolates analysed in triplicate). Arrowheads indicate KI67+ cells. Scale bar=50 µm. (F) Quantification of relative fluorescence intensity of nuclear pSTAT (S727) staining in panel E, for KI67+ and KI67-cells. (G) Representative images of VSMCs isolated from Myh11-Confetti aortas cultured 21 days in +/− 500 ng rhTIMP1 and/or 10 uM TT101 (N=6). Scale bar=500 µm. (H) Number and size of clonally expanded patches formed by lineage labelled VSMCs from Myh11-Confetti aortas, treated as indicated and imaged over 21 days. Q uantified using ImageJ. Statistical significance assessed via generalised linear model. N=6. Asterisk indicates p<0.05.
Article Snippet: Cells were treated with recombinant (r) murine (m) or
Techniques: Recombinant, Western Blot, Binding Assay, Negative Control, Staining, Fluorescence, Isolation, Cell Culture

Journal: bioRxiv
Article Title: Network-based prioritisation and validation of novel regulators of vascular smooth muscle cell proliferation in disease
doi: 10.1101/2023.08.25.554834
Figure Lengend Snippet: (A) Number and size of clonally expanded patches formed by lineage labelled VSMCs from Myh11-Confetti animals, treated with 500 ng/mL recombinant TIMP1 or equimolar amount of N-TIMP1 tracked over 21 days of culture. Statistical significance assessed via generalised linear model. N=4. (B) Representative image of CD74 immunostaining (magenta) in lineage labelled mouse carotids 10 days post ligation of Myh11-Confetti animals. Magnified panels also show DAPI counterstained nuclei (top: merge of Confetti signals, CD74 and DAPI, middle: DAPI and RFP, lower: DAPI and CD74). White pointers marks CD74/RFP double positive cells. N=5 animals. Scale bar=100 µm (overview), 30 µm (zoomed view) (C) Representative image of murine VSMCs treated with 500 ng/mL recombinant murine (rm) TIMP1 four days post isolation and immunostained for pSTAT3 (S727, red) and CD74 (green). Nuclei are counterstained with DAPI (blue). Red pointer marks a STAT3 high cells, arrowhead points to a STAT3 low cell in merged and individual channels. (D) Quantification of cellular CD74 levels in panel C, stratified by high or low nuclear pSTAT3 intensity. N=4 animals, 4 repeats of each. Statistical significance was determined via student t-test. (E) Number and size of clonally expanded patches formed by lineage labelled VSMCs from Myh11-Confetti animals, treated with 500 ng/mL rmTIMP1 and/or a CD74 blocking antibody or peptide. (F) Representative western blot of serum started control human VSMCs (hVSMCs, UT), and cells treated for 5 minutes with 500 ng/mL recombinant human TIMP1 with or without +/− pre-treatment with an antibody (CD74 ab) or a peptide (CD74 pep) that blocks CD74. ( G ) Densitometric quantification of panel F. N=4 hVSMC isolates. ( H ) Representative immunohistochemistry image of CD74 in non-plaque human aorta. αSMA = blue, CD74 = brown. Scale bar=500 µm (overview) and 100 µm (zoomed view). N=7. (I) Representative images of RNA in situ hybridization for ACTA2 (green), TIMP1 (blue) and CD74 (red) in healthy human aorta, and plaque containing carotid. Blue arrows denote TIMP1 / ACTA2 + cells, red arrows denote CD74 / ACTA2 +cells. ( J ) Quantification of the % of ACTA2 positive cells also expressing TIMP1 or CD74 in the medial layer of non-plaque aorta (Healthy media) or in medial (Media Under Plaque) or Plaque regions of carotid endarterectomy samples (N=4 for each condition).
Article Snippet: Cells were treated with recombinant (r) murine (m) or
Techniques: Recombinant, Immunostaining, Ligation, Isolation, Blocking Assay, Western Blot, Immunohistochemistry, RNA In Situ Hybridization, Expressing
Journal: Theranostics
Article Title: Serum Fucosylated Prostate-specific Antigen (PSA) Improves the Differentiation of Aggressive from Non-aggressive Prostate Cancers
doi: 10.7150/thno.10349
Figure Lengend Snippet: Serum levels of glycoproteins and their fucosylated glycoforms in prostate cancer patients detected by multiplex immunoassay.
Article Snippet: Mouse myeloma cell line NS0-derived human
Techniques: Multiplex Assay

Journal: Theranostics
Article Title: Serum Fucosylated Prostate-specific Antigen (PSA) Improves the Differentiation of Aggressive from Non-aggressive Prostate Cancers
doi: 10.7150/thno.10349
Figure Lengend Snippet: The correlation of serum levels of PSA, TIMP1 and tPA with tumor Gleason scores. Different serum glycoproteins are shown in panel a, d and g. Different fucosylated glycoproteins are shown in panel b, e and h. Percentages of fucosylated glycoproteins are shown in panel c, f and i. Colored lines indicate mean values in each group.
Article Snippet: Mouse myeloma cell line NS0-derived human
Techniques:

Journal: Theranostics
Article Title: Serum Fucosylated Prostate-specific Antigen (PSA) Improves the Differentiation of Aggressive from Non-aggressive Prostate Cancers
doi: 10.7150/thno.10349
Figure Lengend Snippet: The correlation of serum levels of PSA and TIMP1 with tumor Gleason scores. Different serum glycoproteins are shown in panel a and d. Different fucosylated glycoproteins are shown in panel b and e. Percentages of fucosylated glycoproteins are shown in panel c and f. Colored lines indicate mean values in each group.
Article Snippet: Mouse myeloma cell line NS0-derived human
Techniques:

Journal: Theranostics
Article Title: Serum Fucosylated Prostate-specific Antigen (PSA) Improves the Differentiation of Aggressive from Non-aggressive Prostate Cancers
doi: 10.7150/thno.10349
Figure Lengend Snippet: Correlation of serum glycoproteins and their fucosylated glycoforms with tumor Gleason scores in prostate cancer patients.
Article Snippet: Mouse myeloma cell line NS0-derived human
Techniques:

Journal: Theranostics
Article Title: Serum Fucosylated Prostate-specific Antigen (PSA) Improves the Differentiation of Aggressive from Non-aggressive Prostate Cancers
doi: 10.7150/thno.10349
Figure Lengend Snippet: Serum PSA, TIMP1 and their fucosylated forms in the separation of Gleason score 6 and Gleason score 7-9 tumors by the receive operating characteristic (ROC) analysis.
Article Snippet: Mouse myeloma cell line NS0-derived human
Techniques:

Journal: Theranostics
Article Title: Serum Fucosylated Prostate-specific Antigen (PSA) Improves the Differentiation of Aggressive from Non-aggressive Prostate Cancers
doi: 10.7150/thno.10349
Figure Lengend Snippet: Serum PSA, TIMP1, and their fucosylated forms in the separation of Gleason score 6 and Gleason score 8-9 by the receive operating characteristic (ROC) analysis.
Article Snippet: Mouse myeloma cell line NS0-derived human
Techniques:
Journal: bioRxiv
Article Title: Network-based prioritisation and validation of novel regulators of vascular smooth muscle cell proliferation in disease
doi: 10.1101/2023.08.25.554834
Figure Lengend Snippet: (A) Predicted inputs to TIMP1 in the PrP GRN, coloured as described in left panel of . (B) Representative immunohistochemistry image for αSMA (blue) and TIMP1 (brown) in non-plaque human aorta (N=7), scale bar=500 µm (overview) and 100 µm (zoomed view). (C) Enrichment plots from gene set enrichment analysis (GSEA) for E2F targets (p adj = 0.005) and G2M checkpoint genes (p adj = 0.04) in bulk RNA-seq data from human VSMCs (hVSMCs) treated with 500 ng/mL recombinant human (rh) TIMP1 for 6 hours versus control cells (N=6 independent hVSMC isolates). (D) Proportion of EdU+ hVSMCs following 16 hours EdU incorporation in cells treated with 500 ng/mL rhTIMP1 or vehicle controls (CTRL), standardised to the average of all samples (N=6 independent hVSMC isolates). (E) Representative images of Myh11-Confetti VSMCs isolated from murine aortas and cultured for 21 days in the presence of vehicle control, 500 ng/mL recombinant murine TIMP1 or 2 ng/mL PDGF-BB. Scale bar=500 µm. (F, G) Quantification of number and size of clonally expanded patches of Confetti+ VSMCs over 21 days of culture. Statistical significance assessed via a generalised linear model, N=4 animals.
Article Snippet: TIMP1-containing fractions were identified by Western blot analysis using the
Techniques: Immunohistochemistry, RNA Sequencing, Recombinant, Control, Isolation, Cell Culture
Journal: bioRxiv
Article Title: Network-based prioritisation and validation of novel regulators of vascular smooth muscle cell proliferation in disease
doi: 10.1101/2023.08.25.554834
Figure Lengend Snippet: (A) Proteome profiler phosphokinase array of human VSMCs (hVSMCs) following 15 minutes treatment of 500 ng/mL recombinant human (rh) TIMP1 or vehicle control. Quantification of relative spot intensity by densitometry. (B) Western blot of total, pS727 and pT705 STAT3 in serum starved hVSMCs analysed 0, 5 10, 15 or 30 minutes after rhTIMP1 treatment. (N=5 hVSMC isolates). (C) Quantification of relative band intensity, normalised to total STAT3 levels (N=5 hVSMC isolates), statistical significance determined using ANOVA. (D) ChIP qPCR analysis of STAT3 binding at STAT3 targets ( TWIST and JUN ) and a negative control ( AMICA1 ) gene promoters, in serum starved control hVSMCs and 15 minutes following 500 ng/mL rhTIMP1 treatment. Graph shows anti-STAT3 and control IgG precipitated DNA as a percent of input. N=3 hVSMC isolates. (E) Representative images of STAT3 and Ki67 staining in serum starved control hVSMCs and after 15 mins 500 ng/mL rhTIMP1 treatment (N=3 hVSMC isolates analysed in triplicate). Arrowheads indicate KI67+ cells. Scale bar=50 µm. (F) Quantification of relative fluorescence intensity of nuclear pSTAT (S727) staining in panel E, for KI67+ and KI67-cells. (G) Representative images of VSMCs isolated from Myh11-Confetti aortas cultured 21 days in +/− 500 ng rhTIMP1 and/or 10 uM TT101 (N=6). Scale bar=500 µm. (H) Number and size of clonally expanded patches formed by lineage labelled VSMCs from Myh11-Confetti aortas, treated as indicated and imaged over 21 days. Q uantified using ImageJ. Statistical significance assessed via generalised linear model. N=6. Asterisk indicates p<0.05.
Article Snippet: TIMP1-containing fractions were identified by Western blot analysis using the
Techniques: Recombinant, Control, Western Blot, ChIP-qPCR, Binding Assay, Negative Control, Staining, Fluorescence, Isolation, Cell Culture
Journal: bioRxiv
Article Title: Network-based prioritisation and validation of novel regulators of vascular smooth muscle cell proliferation in disease
doi: 10.1101/2023.08.25.554834
Figure Lengend Snippet: (A) Number and size of clonally expanded patches formed by lineage labelled VSMCs from Myh11-Confetti animals, treated with 500 ng/mL recombinant TIMP1 or equimolar amount of N-TIMP1 tracked over 21 days of culture. Statistical significance assessed via generalised linear model. N=4. (B) Representative image of CD74 immunostaining (magenta) in lineage labelled mouse carotids 10 days post ligation of Myh11-Confetti animals. Magnified panels also show DAPI counterstained nuclei (top: merge of Confetti signals, CD74 and DAPI, middle: DAPI and RFP, lower: DAPI and CD74). White pointers marks CD74/RFP double positive cells. N=5 animals. Scale bar=100 µm (overview), 30 µm (zoomed view) (C) Representative image of murine VSMCs treated with 500 ng/mL recombinant murine (rm) TIMP1 four days post isolation and immunostained for pSTAT3 (S727, red) and CD74 (green). Nuclei are counterstained with DAPI (blue). Red pointer marks a STAT3 high cells, arrowhead points to a STAT3 low cell in merged and individual channels. (D) Quantification of cellular CD74 levels in panel C, stratified by high or low nuclear pSTAT3 intensity. N=4 animals, 4 repeats of each. Statistical significance was determined via student t-test. (E) Number and size of clonally expanded patches formed by lineage labelled VSMCs from Myh11-Confetti animals, treated with 500 ng/mL rmTIMP1 and/or a CD74 blocking antibody or peptide. (F) Representative western blot of serum started control human VSMCs (hVSMCs, UT), and cells treated for 5 minutes with 500 ng/mL recombinant human TIMP1 with or without +/− pre-treatment with an antibody (CD74 ab) or a peptide (CD74 pep) that blocks CD74. ( G ) Densitometric quantification of panel F. N=4 hVSMC isolates. ( H ) Representative immunohistochemistry image of CD74 in non-plaque human aorta. αSMA = blue, CD74 = brown. Scale bar=500 µm (overview) and 100 µm (zoomed view). N=7. (I) Representative images of RNA in situ hybridization for ACTA2 (green), TIMP1 (blue) and CD74 (red) in healthy human aorta, and plaque containing carotid. Blue arrows denote TIMP1 / ACTA2 + cells, red arrows denote CD74 / ACTA2 +cells. ( J ) Quantification of the % of ACTA2 positive cells also expressing TIMP1 or CD74 in the medial layer of non-plaque aorta (Healthy media) or in medial (Media Under Plaque) or Plaque regions of carotid endarterectomy samples (N=4 for each condition).
Article Snippet: TIMP1-containing fractions were identified by Western blot analysis using the
Techniques: Recombinant, Immunostaining, Ligation, Isolation, Blocking Assay, Western Blot, Control, Immunohistochemistry, RNA In Situ Hybridization, Expressing